ChartAI reviews — what users really think

last reviewed 24 march 2026
how we review

We start with direct ratings from our readers, then look at what real users are saying in practitioner forums and community spaces. We pair that with search demand data and profession-level persona analysis.

full methodology →

Editorial note: this was originally published in april of 2025

quick take

  • Best for: quick internal Gantt charts and timelines from natural language
  • Skip if: you need client-facing deliverables or BI tool integration
  • £Best value: free trial only until Pro pricing is justified by a track record
3.0/ 5 — editorial rating

based on real user feedback, community sentiment, pricing value, and fit for target audience. see our full methodology

used ChartAI? we'd love to know your thoughts

reader ratings shape our score

ChartAI is a data visualization and diagram creation tool that transforms natural language prompts and data inputs into professional charts and diagrams. Using AI technology, it helps users create visual representations of their data without technical knowledge.

The platform generates multiple chart types, from flowcharts to user journey maps and timelines. Users can input UX requirements or data to create visualizations. The AI optimizes timelines, adjusts charts, identifies dependencies, and generates layouts automatically. The web-based interface at chartai.io makes it easy to start creating diagrams without downloads or installations.

Customization options are limited. It operates on a subscription model with a 14-day free trial available for new users to test the platform's capabilities. The free tier includes basic tools with usage limits and slower processing times compared to paid plans.

Business professionals, project managers, UX designers, and business analysts will find ChartAI useful for creating presentation-ready visualizations and project planning materials. The platform competes with tools like Lucidchart, Visio, Tableau, and Power BI but focuses on AI-driven generation rather than manual creation.

how popular is ChartAI?

monthly search interest

170/mo now

01653305002023202420252026
peak interest480/moDec 2024
searches now170/moFeb 2026
1-month change19%vs prev month

ChartAI grew steadily through 2023 into early 2024, peaked sharply in December 2024, and has since dropped back to below mid-2023 levels. That pattern suggests the December spike was a one-off visibility moment rather than sustained growth, and the tool is now settling into a small but stable niche audience. The real user base is probably modest, which matches the near-total absence of independent community feedback you'll find when researching it.

who is ChartAI for?

Whether ChartAI clicks for you depends a lot on what you're actually building and how much polish you need. Pick your role below to see whether it fits your specific workflow.

overall sentiment

select your role to see what people like you are saying

Project Manager

mixed

If you're spending hours dragging elements around in Visio or MS Project, ChartAI's natural language input genuinely speeds up Gantt chart and timeline creation. The free trial is worth testing on a real project. That said, there's no public evidence of how it handles complex multi-phase dependencies, so don't retire your existing planning tools until you've put it through something demanding.

strengths

  • Eliminates hours spent arranging elements in complex software like Visio or MS Project
  • Generates polished timelines and Gantt charts from natural language input
  • Enables quick iteration on planning diagrams during team meetings
  • Reduces need for design skills or external designer requests

concerns

  • Limited public reviews make it hard to assess reliability for mission-critical project documentation
  • Unclear how well it handles complex multi-phase projects with dependencies
  • No established track record in professional project management workflows

what users are saying

At $166 CAD per month per user, you're paying a premium for a tool with a broken pricing page and no public track record, which is a hard sell.

Community discussion around ChartAI is thin. The only substantive source available is a walkthrough article comparing the tool against Lucidchart, Power BI, TradingView, and TrendSpider. The piece notes that 'ChartAI' itself is a somewhat ambiguous name covering at least three distinct products across trading, data visualisation, and dental software, which creates real confusion when searching for user feedback. What's findable about the diagramming product at chartai.io is almost entirely from the tool's own homepage rather than independent reviewers. The pricing page returns a 404 error, which doesn't help confidence. There are no Reddit threads, no forum discussions, and no independent blog posts specifically reviewing the chartai.io diagramming tool, which makes honest assessment difficult.

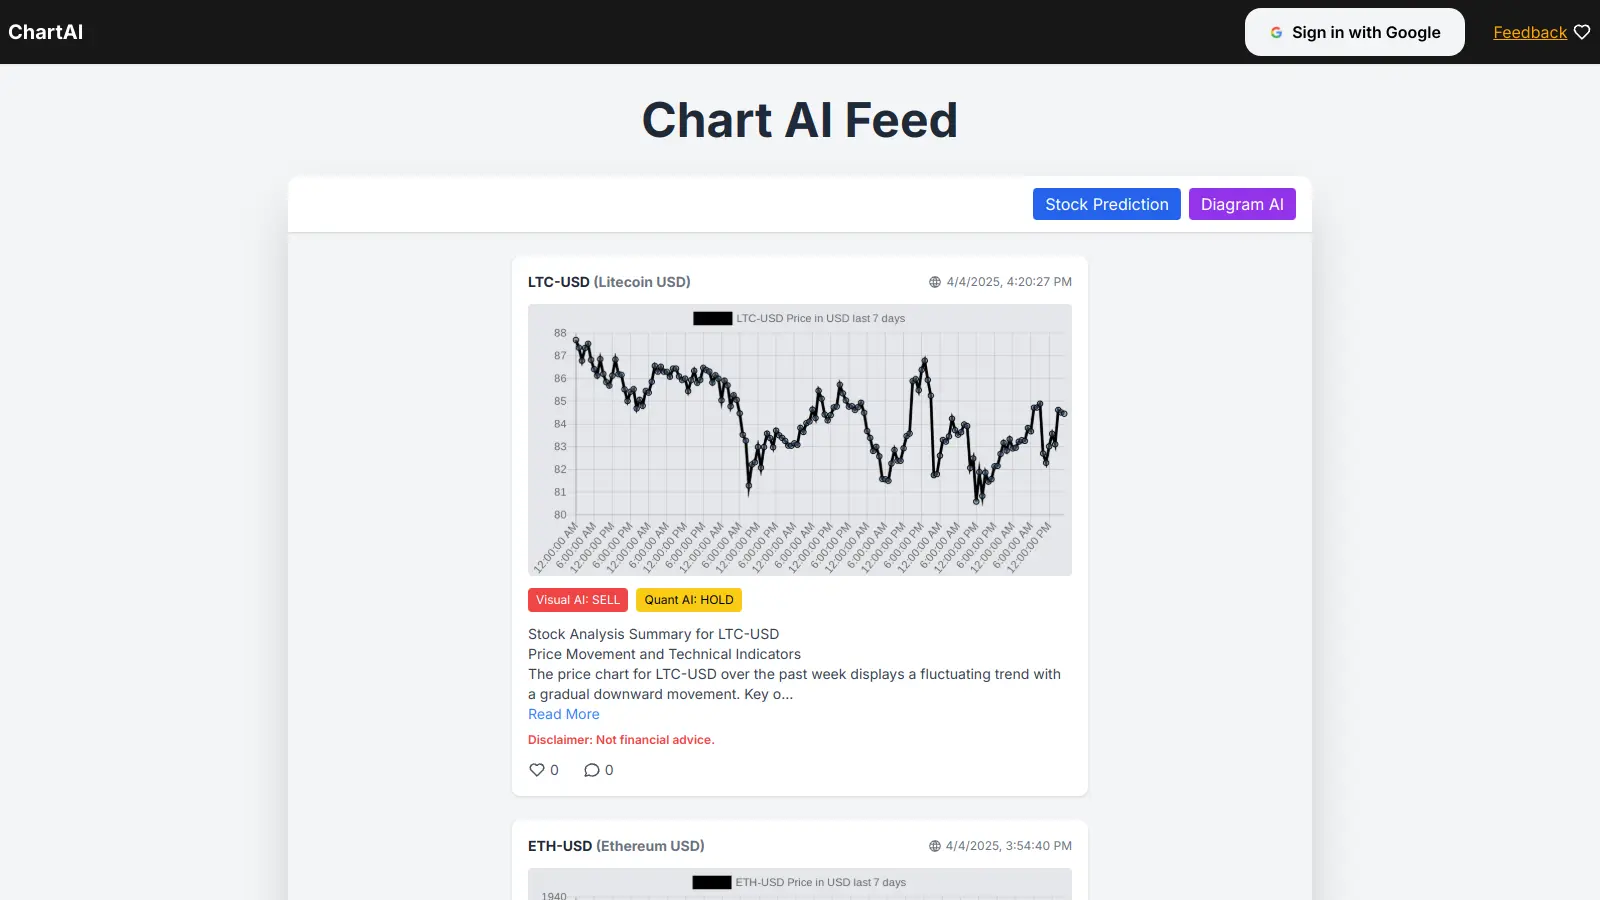
Our take: The tool itself is functional: the homepage generates flowcharts, Gantt charts, timelines, and mind maps from natural language prompts, and the free trial requires no credit card. But the Pro tier is priced at $166 CAD per month per user, which is steep for a diagram generator with no public track record and a pricing page that doesn't load. If you need AI-assisted diagramming and want something with a proven user base and comparable features, Lucidchart is the more defensible choice for anything client-facing. ChartAI is worth trying on the free trial for quick internal diagrams, but don't pay $166/month until there's more evidence it earns that price.

features

  • AI-Driven Diagram Generation: Create charts and diagrams within minutes by inputting natural language prompts or data, with AI handling the visualization tasks.
  • Multiple Chart Types: Generate flowcharts, user journeys, timelines, layouts, and data visualization charts.
  • Smart Optimization: AI automatically optimizes timelines, adjusts charts, and identifies dependencies to create well-structured diagrams.
  • UX Journey Mapping: Create user journeys from UX requirements to visualize customer experiences and workflow processes.
  • Template Tools: Access AI templates that speed up diagram creation and provide starting points for common chart types.
  • One-Click Copy/Paste: Transfer your diagrams into presentations, documents, and other applications with simple copy and paste functionality.
  • Recording Tools: Built-in recording capabilities help capture and document your diagram creation process and workflow.

pricing

  • Starter: 14-day free trial with no credit card required. Includes free recording tools, charting tools, template tool, edit tools, and 1-click copy/paste. Usage limits apply and processing time is slower than paid plans.
  • Pro: $166/month (CAD per user, plus taxes). Includes enhanced recordings with no restrictions, all AI templates, free editing, faster processing, unlimited recording length, 1-click copy/paste, 1 year encrypted data retention, and online support. Pay annually and get 2 months free.
  • Ultimate: Currently waitlisted. Includes all Pro features plus adaptive AI charting, clinical memory, autonomous workflow, total PMS integration, 16 year data retention, and dedicated support manager.

frequently asked questions

The free trial is worth testing since no credit card is required. The Pro tier at $166 CAD per month per user is hard to justify given the absence of public reviews, a broken pricing page, and no demonstrated integration with tools like Tableau or Power BI. At that price you're competing with Lucidchart and other established platforms with real support and track records. Hold off on Pro until you've validated it handles your specific workflow.

Project Managers who need quick Gantt charts and timelines without touching Visio or MS Project will get the most out of this. Business Analysts who produce same-day reporting visuals for stakeholders are the other strong fit. UX Designers can use it for early-stage journey mapping, but it's riskier for client-facing deliverables where brand consistency matters.

First, there's essentially no independent community feedback available, which makes it hard to trust for anything mission-critical. Second, the pricing page returns a 404 error, which is a basic reliability signal that's hard to ignore. Third, there's no evidence of integration with BI tools like Power BI, Tableau, or Looker, which limits its usefulness for Business Analysts already embedded in those ecosystems. Fourth, at $166 CAD per month, the price-to-track-record ratio is unfavourable.

Lucidchart is the safer default for anything you're sharing with clients or stakeholders. It has years of public feedback, known integrations, and an established pricing structure. ChartAI's advantage is the natural language input for generating diagrams from scratch fast, which Lucidchart doesn't do as cleanly. If you're doing internal brainstorming or quick planning visuals, ChartAI's free tier is worth a try first. If you're producing client deliverables or need reliability guarantees, use Lucidchart.

Unknown, honestly. The tool advertises Gantt charts and timeline generation, and the homepage suggests dependency identification is part of the AI optimisation. But there's no public evidence from Project Managers who've tested it on multi-phase projects with real dependency chains. Use the free trial specifically to stress-test a complex project you know well, and compare the output to what you'd produce manually before committing to a paid plan.

tools for
humans

toolsforhumans editorial team

Reader ratings and community feedback shape every score. Since 2022, ToolsForHumans has helped 600,000+ people find software that holds up after launch. how we research →

other tools to check out

Google Analytics screenshot
online buzz368k
trend (1M)steady
3.8based on real user feedback, community sentiment, pricing value, and fit for target audience. see our full methodology

Google Analytics

Google Analytics is a free web analytics service by Google that helps businesses track and analyze website and app performance. It provides insights into user behavior, traffic sources, engagement, and conversions through real-time reports, audience segmentation, and advanced tracking tools. The latest version, GA4, offers machine learning capabilities, improved privacy features, and event-based tracking to measure online interactions across platforms.

best deal

Start with Google Analytics Free - Track visitor behavior, create custom reports, and get real-time insights across all your platforms at zero cost.

SurveyMonkey screenshot
online buzz165k
trend (1M)steady
3.5based on real user feedback, community sentiment, pricing value, and fit for target audience. see our full methodology

SurveyMonkey

SurveyMonkey is an online survey platform that enables users to create, distribute, and analyze surveys with customizable forms and AI-powered tools. It offers multiple question types, survey templates, advanced logic, and analytics tools. Used by individuals and enterprises, SurveyMonkey provides integrations with other tools and flexible pricing plans for research and feedback collection.

best deal

Try SurveyMonkey's Basic Plan free – Create unlimited surveys with up to 10 questions each

Whimsical AI screenshot
online buzz135k
trend (1M)18%
3.5based on real user feedback, community sentiment, pricing value, and fit for target audience. see our full methodology

Whimsical AI

Whimsical is a collaborative visual workspace that helps teams brainstorm, plan, and execute ideas through integrated tools like flowcharts, wireframes, mind maps, and docs. It offers real-time collaboration, AI-powered assistance, and an intuitive interface for project management, with pricing plans ranging from free to enterprise-level solutions.

best deal

Start with Whimsical's Free Plan - No credit card required. Get unlimited workspace members, 3 team boards, unlimited docs, and 100 AI actions to visualize your ideas today.

Columns AI screenshot
online buzz110k
trend (1M)steady
3.5based on real user feedback, community sentiment, pricing value, and fit for target audience. see our full methodology

Columns AI

Columns AI is a data storytelling platform that automates the creation of interactive visualizations and data stories from spreadsheets, databases, and APIs. It uses artificial intelligence to help marketers, analysts, and data teams transform raw data into narratives with annotations, animations, and voice overs. The platform offers an intuitive interface, data catalog management, and collaboration tools with pricing starting from a free tier up to $75 per year for premium features.

best deal

Lifetime deal available for $99 through AppSumo (89% off) – includes AI data storytelling and interactive visualization features

MyMap.AI screenshot
online buzz91k
trend (1M)18%
3.5based on real user feedback, community sentiment, pricing value, and fit for target audience. see our full methodology

MyMap.AI

MyMap.AI is an AI-powered tool that transforms ideas into visual diagrams through a conversational interface. It enables users to create mind maps, flowcharts, and presentations by chatting with AI, supporting multiple file formats, real-time web search integration, and collaborative editing. With over 500,000 users, the tool simplifies complex information visualization with export options to PNG, SVG, PDF, CSV, Markdown, and Project formats.

best deal

Try MyMap.AI's Pro plan for $1 for the first 3 days, then $20/month for unlimited AI-powered diagram creation

Rows AI screenshot
online buzz61k
trend (1M)steady
3.5based on real user feedback, community sentiment, pricing value, and fit for target audience. see our full methodology

Rows AI

Rows is a cloud-based spreadsheet platform that integrates AI capabilities natively, enabling teams to connect, analyze, transform, and automate data from multiple sources without coding. It offers AI-driven data analysis, enrichment, automated tasks, and integrations with popular tools, databases, and APIs. The platform provides real-time collaboration, customizable templates, and tiered pricing plans to suit individual and team needs.

best deal

Try Rows Free Forever: Get unlimited spreadsheets and team members, 1,000 integration tasks, and 500 AI enrichment tasks monthly with no credit card required